Basic Capnometry Application User Guide
Contents
- Introduction & Launching the Application
- Input Parameters
- Feedback Parameters
- Working with the Basic Capnometry Application (User Interface)
- Feedback & Thresholds
- Breath Counting Functionality
- Report Functionality
Introduction
This guide introduces the Basic Capnometry biofeedback application, part of the Mind-Body Training Tools suite. MBTT applications are designed to train self-regulation skills, which I sometimes call mind-body skills.
The guide has two purposes: firstly to give an overview of capnometry biofeedback, and secondly to teach you how to use the software – though it is more of a reference than a tutorial.
The application is designed to train optimal breathing in a group context. A capnometer measures end-tidal carbon dioxide in exhaled air, which is known to correlate with the level of carbon dioxide in blood. The latter is an important physiological parameter, as it controls vasodilation, most prominently in the brain. Over-breathing or hyperventilation causes depletion of blood carbon dioxide and thus restriction of oxygen delivery to brain cells, while conversely capnometry biofeedback is a means of training optimal oxygen delivery to brain cells.
The application is designed to work with a group of up to eight individual trainees, each connected to their own capnometer device. The software monitors a single physiological parameter from each capnometer: partial pressure of carbon dioxide in inhaled air (PP CO2). Think of this as the concentration of CO2. The software calculates the end-tidal CO2, or the peak in the PP CO2 signal over the course of a breath – this is the most significant parameter. Additionally the software can calculate breathing rate.
At the end of a session data is stored for each of the (up to) eight users, and you can generate session reports for each individual (see section 7 below).
The guide assumes that you already have a basic knowledge of how to work with Mind-Body Training Tools software. If not, I suggest you read this Introductory Guide to Working with MBTT.
Launching The Application
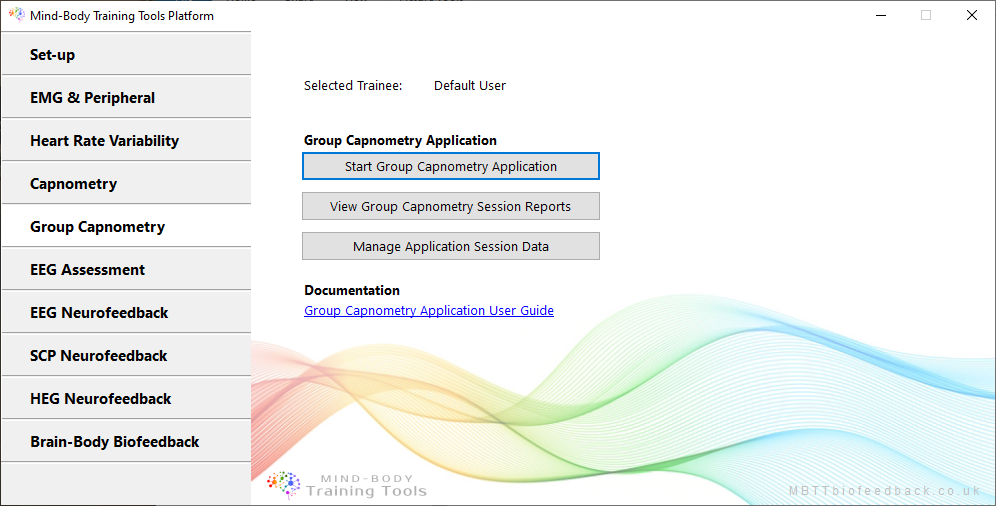
To launch the application (after starting the platform program) first click on the "Group Capnometry" tab, then then click the button, “Start Group Capnometry Application”, to launch the app.
Parameters
As with the Basic Capnometry app, there is a single input parameter, namely partial pressure of carbon dioxide, hereafter PP CO2, which is explained more fully in this article about capnometry and breathing measurement. Of course the difference is that there are up to eight data streams coming from different devices.
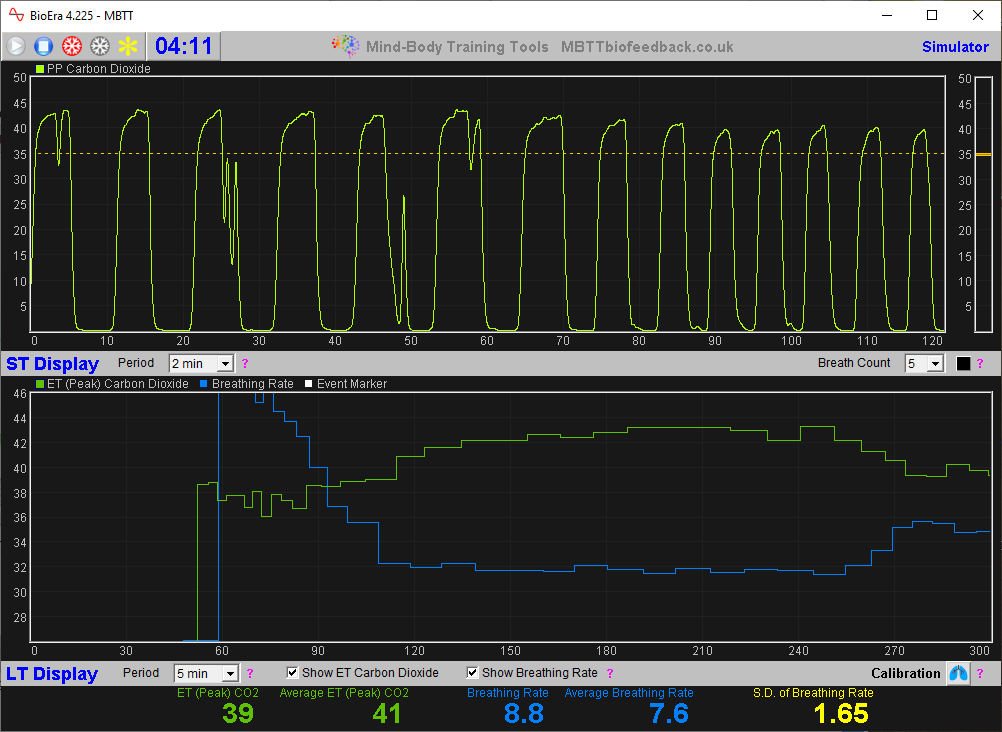
From each PP CO2 signal, the application calculates the following feedback parameters:
- End-tidal PP CO2 - the peak heights of the breathing trace. This is the key physiological measure.
- Breathing Rate
Working With The Basic Capnometry Application (User Interface)
The MBTT apps have a common design scheme. The intent is that learning to use one app, can be generalised so that other apps in the suite are easy to learn.
The apps generally have three windows:
- Main window, or trainer's window, containing parameter charts
- Threshold window - each app has at least one threshold, but there are usually more.
- Feedback window - in a sense, all charts and thresholds are giving feedback, but the feedback window contains controls for audio feedback plus more specialised feedback forms.
The main screen looks like this:
The following video offers a tour of the Group Capnometry app UI. TO_DO
Feedback & Thresholds
In biofeedback, physiological parameters are mapped into visual or auditory form, so that the trainee can perceive changes directly through his senses. Feedback can be continuous and proportional to the parameter, for example a tone whose pitch and/or volume varies with the parameter, or it can be discrete and dichotomous, for example a bell sounds whenever muscle tension rises above some limit.
Thresholds are the means of configuring the mapping, meaning they define how much of the parameter results in how much feedback.
Report Functionality
Mind-Body Training Tools allows you to generate session reports and application reports.
The controls for report generation are found in the platform window, in the Capnometry tab shown towards the beginning of this document. You need to have selected the right application from the drop-down list - in this case Basic Capnometry.
A session report shows charts and tables for the feedback parameters summarising the whole session. You'll be asked to select one particular session, and given report options. The options dialog looks like this:
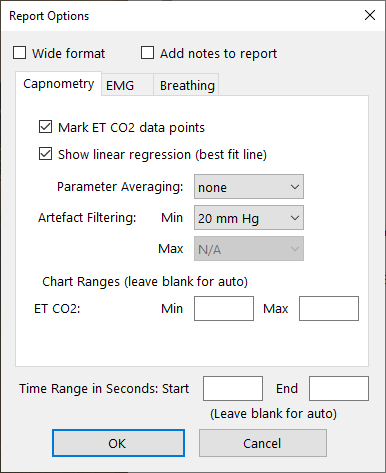
The application report shows the variation of the feedback parameters across multiple sessions. Typically for each feedback parameter, the software generates line charts for session means, session maxima and session minima.
Report functionality is described in greater depth here.
You can see sample reports here:
Sample Capnometry Session Report TO_DO
Sample Capnometry Application Report TO_DO