Guide to Thresholds in Mind-Body Training Tools
This guide is a general introduction to working with thresholds and how to use them to configure feedback in Mind-Body Training Tools. It's not specific to any single application, since virtually all the apps in the MBTT suite employ thresholds.
It's assumed here that you already have MBTT software set up, and that you've read the General Guide to Working in Mind-Body Training Tools.
Purpose of Thresholds
In biofeedback, physiological parameters are mapped into visual or auditory form, so that the trainee can perceive changes directly through his senses. Feedback can be continuous and proportional to the parameter, for example a tone whose pitch and/or volume varies with the parameter, or it can be discrete and dichotomous, for example a bell sounds whenever muscle tension rises above some limit.
Thresholds are the means of configuring the mapping, meaning they define how much of the parameter results in how much feedback.
In the software, a threshold consists of a bar graph with one or two levels or bars, plus a set of controls. Generally there is one threshold per feedback parameter, and most apps have a number of thresholds. Here is a simple threshold, in this case for breathing rate:
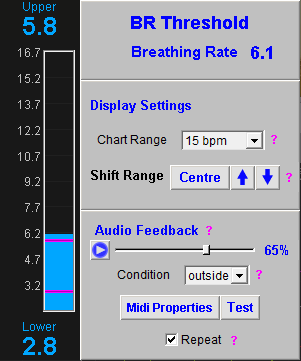
(The two levels are the magenta-coloured bars, and at the top and bottom you see displayed the parameter values at which they are currently set.)
The vast majority of thresholds in MBTT have two levels, unlike many other neurofeedback software products. While having two levels may seem to complicate things, it opens up the ability to offer genuinely proportional feedback.
An example of proportional feedback is using a “shadow” to darken or lighten a video. The video's brightness can vary smoothly between a maximum and minimum. The two threshold levels define the maximum and minimum brightness points.
The controls on the right side of the figure can be used to set:
- The amount of averaging or smoothing (over time) of the feedback parameter.
- The range or scale of the bar chart. The scale can be increased if the signal tends to vary above or below the bounds of the chart, and decreased when the variability of the signal appears low. The signal can also be shifted up and down while keeping the scale fixed, using buttons.
The level(s) or bar(s) in the chart are key to using thresholds effectively.
The main principle is that feedback should be balanced: not too challenging for the trainee, and not too easy. The range of variation should be not so great as to be chaotic and not so narrow as to be uninformative.
In the case of simple or basic thresholds such as the one shown above, the threshold levels are adjusted by dragging them with your mouse.
Other Threshold Controls
Besides the draggable levels, there are other controls in the threshold. In the basic threshold above, you see a box with controls for adjusting the bar chart display - you can set the (vertical) range or scale of the parameter. You can also adjust the signal up or down in the chart without changing the scale, using the three buttons (centre, and up and down arrows).
Between them these controls are useful when the parameter changes enough to take it out of the displayed range.
Please note, in most cases shifting the range of the parameter bar chart in the threshold also affects other chart(s) in the app, such as the long-term trend chart.
Advanced Thresholds
Below you see a more complex threshold. Most of the thresholds in MBTT apps are of this sort. The additional controls allow you to set and update the threshold levels automatically according to certain criteria.
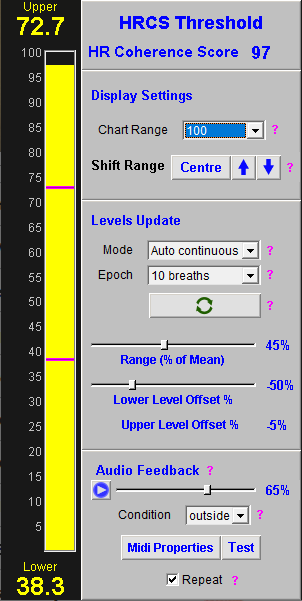
You can have the software update the levels continuously, or you can update the levels to some calculated new values by clicking a button. For the former, set the mode drop-down to “auto-continuous” and for the latter, set it to “manual or button”. In this latter mode, you can either drag the levels by hand, as you do for simple thresholds, or you can click the “update” button to shift the levels to a calculated value.
Threshold Level Calculation
How does the software calculate a new threshold level, either for continuous update or for button-controlled update? It depends on the parameter in question, and the nature of how it varies over time. The calculation can be based on percentiles or on the mean (average).
Threshold Epochs
In either case, the calculation is based on how the parameter has varied over a recent period of time, called an epoch. An epoch might be 20 or 30 seconds in length, or it might be several minutes for parameters that vary more slowly. In some cases epochs are not measured in seconds but in number of breaths.
Calculation Based On Percentiles
Percentile based calculation is used for most EEG parameters. First to we need to understand what percentiles are - it is a concept widely used in data analysis and statistics.
Suppose you measure a parameter such as “alpha amplitude” over an epoch of say 10 seconds, using a sample rate of 100 (meaning the threshold software receives 100 numbers per second). That gives 1000 numbers, all representing alpha amplitude at different points in time.
The software will sort these 1000 from smallest to largest.
Suppose you set your threshold level to be at the seventieth percentile. Put simply, it means the parameter was below this level 70% of the time, and above it 30% of the time. The software calculates this level by taking the 700th number in its ordered list from smallest to largest.
This ordered list is always based on the most recent period of time, and has to be continuously updated by the software. That's why the seventieth percentile itself continuously changes.
In the same way, the twentieth percentile is the level below which the parameter spends 20% of the time, and above 80%.
Calculation Based on the Mean Value
While a percentile-based calculation works well for EEG parameters such as alpha amplitude, it is less appropriate for others such as Heart Coherence Score or breathing rate. In this case the sample rate is much slower - you get one “sample” or breathing rate measurement per breath in the case of breathing rate, and two in the case of HCS.
Another complication is that sometimes there is very little variability - for example you could breathe at a constant rate of about 6 bpm for a full two minutes - the first percentile might be 5.6 while the 100th might be 6.5 bpm - not a large range.
In these cases I've found it works better to take the mean (average) parameter value over the epoch, and then calculate a range based on this. The mean breathing rate could be say, 6.0 bpm, and you could set the threshold range as 50% of this, or 3.0 bpm.
The controls allow you to set the lower threshold level at some offset value based on the mean - say 10% below the mean, and then the upper level would be 40% above the mean. In my example the levels would then be at 5.7 and 7.2 bpm.
Thresholds in EEG Neurofeedback Apps vs. Peripheral Biofeedback Apps
Earlier we saw an example of a Heart Coherence Score threshold. This uses threshold level calculation based on the mean value. In many of the peripheral biofeedback apps, this is the most appropriate method, especially for breathing-related parameters.
In contrast, in the EEG neurofeedback apps, thresholds use the percentiles method for calculating levels. Here is an example of an EEG threshold:
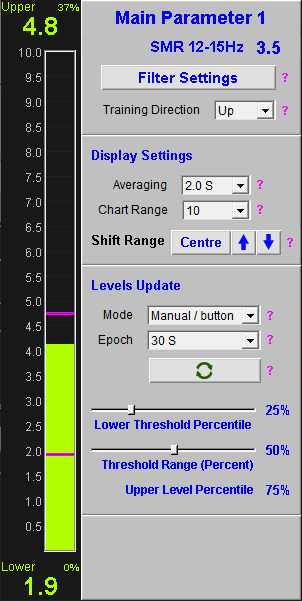
You see that the controls are slightly different - you can set firstly the range in percent between the upper and lower levels, and secondly the percentile of the lower level.
(Of course the upper level is the range minus the lower percentile, and this is also shown.)
Current Percentiles of Threshold Levels
When the threshold levels are not continuously updating, it means that they don't necessarily reflect the percentiles at which they were first set.
Suppose you're doing an EEG neurofeedback session, and you start by setting your threshold levels to the 25th and 75th percentiles, based on 1 minute of “baseline” data. Suppose further that after 10 minutes of training, you've shifted your EEG by a significant degree. Now, the 25th and 75th percentiles based on the most recent 1 minute of data will be different from what they were at the start of training.
(If you were to click the Update button, you would set the levels jump to a new place.)
The software estimates the current percentiles of the levels, based on the most recent data. These are shown as small numbers in the corner of the numeric displays that show the current level values. This information might inform your decision as to how and when to update the levels.
Proportional Video Feedback Again
Returning to our earlier example of using proportional brightness feedback in conjunction with a video. Suppose we're training EEG SMR amplitude upwards. In our SMR threshold, we could set the threshold range to be 50% - this means the upper and lower levels are 50 percentiles apart. We could set the lower level to be at the 25th percentile, and this would put the upper level at the 75th percentile.
Roughly speaking, these settings would mean the video would play at full brightness for one quarter of the time, and maximum darkness for another quarter of the time. The remaining time (i.e. half the time) it would be somewhere in between.
EMG (Muscle Tension) Feedback
In MBTT, the thresholds used for EMG are a special case, owing to the way muscle tension typically varies. For example, the Basic EMG application's threshold is shown here:
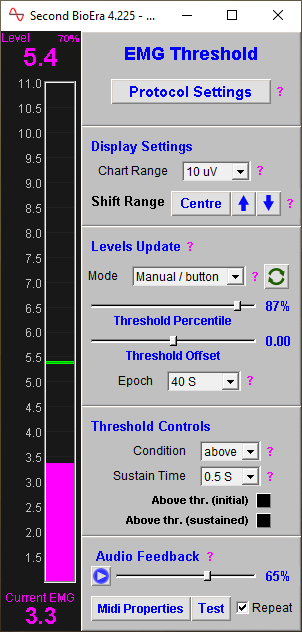
The biggest difference is that there is only a single level. The automated calculation is based on a percentile, plus an offset either up or down, in microvolts (this being the unit of the EMG parameter).
You can thus for instance set the threshold level at the 25th percentile, plus an upward offset of 0.5 microvolts.
EMG as a biofeedback parameter tends to vary in a particular way, that's different from other biofeedback parameters. Suppose you have your sensors on the forehead (which gives a general measure of tension in the face and head). What you often see in the EMG signal is periods of stability interspersed with movements or “fidgets” that produce sharp peaks in the signal that go much higher than the baseline.
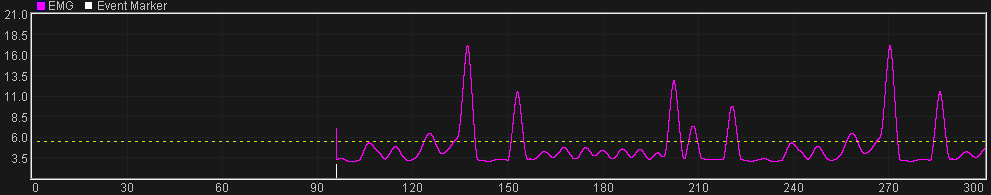
These peaks have the effect of raising the mean well above the natural “baseline”. So using the mean as a basis for calculating the threshold level, in practical terms, is less than ideal.
On the the other hand, you can get something that's much closer to the “baseline” by taking a percentile, perhaps the 20th.