EEG Assessment Module User Guide
Contents
- Introduction & Overview of the Assessment Process
- Before Recording Data
- Overview of the Assessment Data
- The EEG Data Recording App
- Data Analysis & Report Generation
- Managing Data
Introduction & Overview of the Assessment Process
Neurofeedback is a process of exercising some particular aspect of brain functioning, with the aim of enhancing performance. Often the choice of what specific aspect is guided by an assessment of the individual brain's style of functioning.
This user guide presents the EEG assessment functions available with the Mind-Body Training Tools (MBTT) software. In broad terms there are two stages of the EEG assessment process:
- gathering (recording) EEG data and
- analysing the data and presenting it in summary reports.
The software is designed for flexibility: you can create as much or as little assessment data as you consider appropriate. You choose the sites to record from, using 1, 2, 4 or 8 channels at a time. You select a protocol which dictates the sequence of recording conditions (eyes closed, eyes open, etc.).
This guide teaches you how to use the MBTT assessment software but assumes you already understand what EEG is and how it is measured, quantified and interpreted. It does not cover hardware set-up, including sensor placements, or how to select a training protocol based on the assessment.
We assume that you've successfully installed the software, and carried out some initial set-up tasks, such as selecting the type of EEG amplifier you're using. If you haven't done so yet, see the Installation and Set-up Guide.
The assessment process is managed from the Platform application, described in the Installation and Set-up Guide. For the data gathering phase, the software uses an application built with BioEra, a third-party software product.
The software works with several devices. You have the option to select 'Simulator' as the EEG source. This offers a means of learning to use the software without the encumbrance of the hardware set-up. The software simply replays an EEG recording (in a loop) as though it were live data. You can go through all the steps of assessment, but of course the resulting analysis will not be realistic.
Overview of the EEG Assessment Process
To recap: there are two main stages (i) data collection and (ii) analysis and report generation. The software offers flexibility:
- You can record 1, 2, 4 or 8 channels of EEG at a time.
- You choose what sites on the scalp to record from and how many.
- The software can combine data from several recordings into a single summary report.
- You can record EEG under different conditions, such as eyes-closed (EC), eyes open (EO) or challenge condition (CC). At the beginning of a recording you'll select an assessment protocol, which essentially encodes a sequence of these conditions, e.g. EC followed by EO followed by EC again.
The software uses both digital filtering and FFT methods of analysis. The EEG data consists of band amplitudes (derived from filters), dominant frequencies, and for 2, 4 or 8 channel recordings, coherences.
Once you've recorded your EEG data, you can analyse it by creating reports. Reports are a way of summarising useful EEG patterns and markers. They offer amplitude comparison charts, amplitude band ratios (including theta to beta), spectral analysis charts, condition comparisons (e.g. EC vs. EO) and line charts showing progression of band amplitudes over time.
There are four report types:
- Single site report – offers a more detailed look at data from a single site.
- Sites comparison report – offers a side-by-side view of any two sites, for comparison.
- Assessment report – this draws together data from all sites and is thus the most important.
- The Site Progress Report - this type is different insofar as data is drawn from multiple assessments made over time, for a single site such as Cz, and it aims to show progression or change in the EEG over time.
Reports are created in html format and are opened for viewing in your computer's default web browser.
The software can exclude artefact from the analysis. Artefact is a component of the measured signal that does not originate from the brain – example sources of artefact are eye blinks and muscle tension. The software has tools to allow you to mark sections of the data which contain artefact. These sections are not used in the report calculations.
The final section of this guide covers some data management functions available in MBTT. If you are a professional practitioner you can quickly build up a lot of data, and you may choose to archive or even delete some assessments. You can also email reports – since they're in html format they can be opened by anyone in a web browser – the recipient doesn't need to have MBTT installed.
Practical Steps for Running an Assessment
This section describes the practical steps needed to run an EEG assessment. Later sections explain what's involved in these steps in greater detail.
TO_DO this video demonstrates the use of the assessment software.
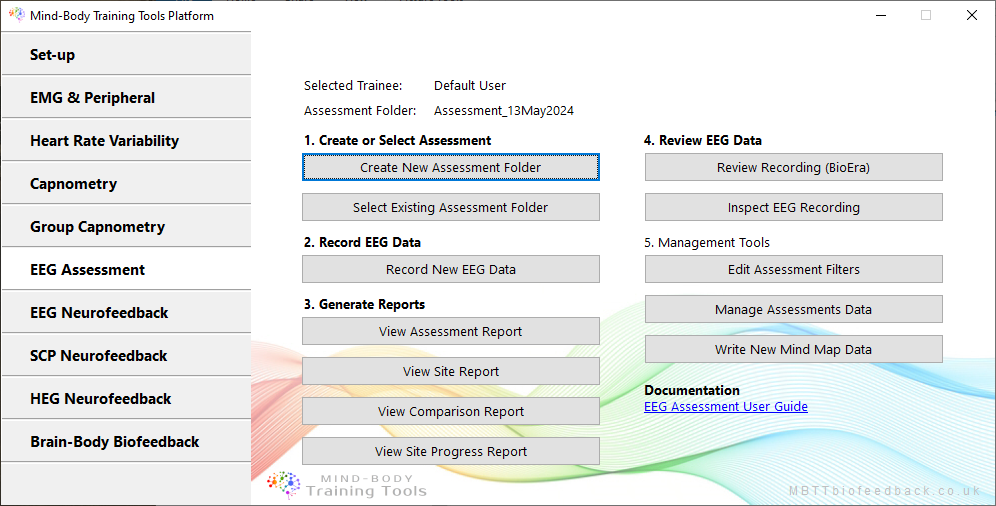
The EEG Assessment tab of the Platform application is shown here - it features a set of buttons that reflect the sequence of steps.
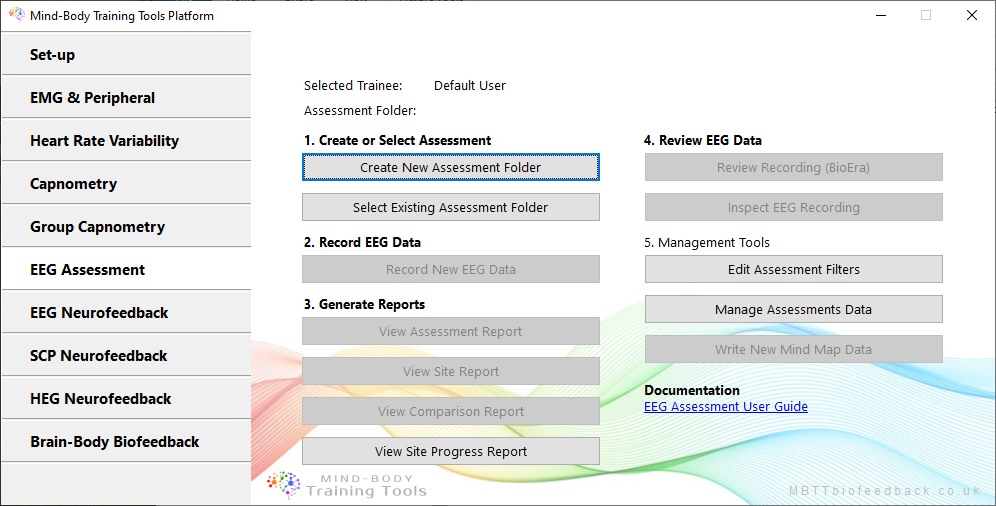
In summary the steps are:
- Create a new user or select an existing user. This step is done from the Set-up tab of the Platform – press the User & Data Options button. See the Installation and Set-up Guide for more details.
- Create a new assessment folder, which will store all the files associated with your assessment. This folder will be created in your user folder. (You can also select an existing folder, but in most cases it would make more sense to create separate assessment folders for data recorded at different times.) Press either of the buttons, 'Create New Assessment Folder' or ‘Select Existing Assessment Folder’.
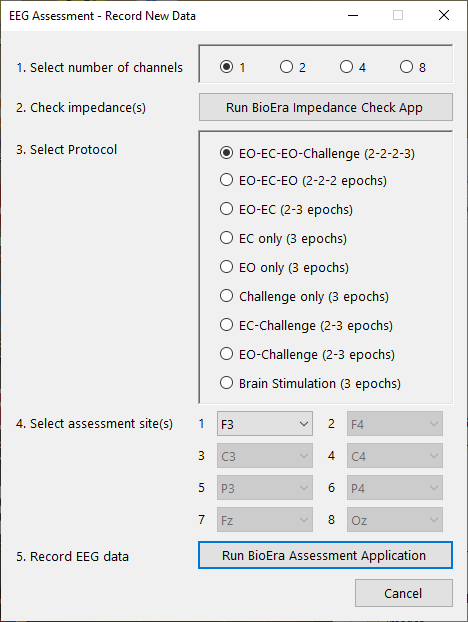
- Record EEG data using the BioEra EEG data recording application. Typically you'd run this step more than once (with different sites) to create a more comprehensive assessment. Press the button 'Record New EEG Data' to start this application. The Record New Data dialog window will appear, asking you to make a few decisions.
- You can check the quality of your electrode connections using the BioEra impedance check app (step 2 in the dialog). Note, this option is not available for every device type.
- When you've recorded as much data as you want, create an assessment report. This summarises all the data and highlights key patterns and relationships, for all the recorded data. Simply press the button 'View Assessment Report' – the report will open in your default web browser (it is created in html format).
- If you want a closer look at the data you can create a single site report or a sites comparison report, by pressing the other the buttons in the Platform. You'll be prompted to select site(s) from amongst those you recorded from. Most users won't need this step because the overall assessment report will be sufficient.
- A further option for analysing data is to use the BioEra assessment review application. Pressing the button, 'Review Recording – BioEra' starts this application. It shows the progression of the main frequency band amplitudes over the course of the recording session. An important difference is that artefact has not been excluded from this data.
- If you want to inspect the raw EEG data, this is possible too, though it requires you to download a third-party application such as EDFbrowser (free to download and use - this is described in more detail below). Press the 'Inspect EEG Recording' button, and you'll be prompted to select one of your site recordings.
Before Recording Data
Before you record data you need to plan exactly what / how much data you need. You need to make decisions as to which sites on the head to record from, under what conditions (EC, EO, etc.).
Your choices will depend in part on what kind of device you're using and how many channels of EEG it offers. Recording with more channels obviously saves time, and means data from different sites is more reliably comparable.
The Record EEG dialog shown above has options to set:
- number of channels - 1, 2, 4 or 8 (step 1)
- recording protocol (step 3) - you select from a list of assessment protocols, which dictate the sequence of stages in the recording, and what condition (EC, EO etc.) should apply in each stage.
- nominate the sites you are recording from (step 4) - it's important to take time and care to get this right, and that your selection matches the correct order of channels - the software itself only knows how many channels it's working with and can't check where you've put the electrodes.
You also need to decide how long to record for. This is actually done later, from with the BioEra Recording app.
Filter Frequency Settings & Coherence Settings
The standard EEG frequency bands, delta, theta, alpha etc. are by no means universally agreed and cast in stone. For example, some might consider theta as 4-8 Hz while others 4-7 Hz.
MBTT allows you to adjust the settings of the digital filters used to calculate band amplitudes, but it needs to be done before you start recording. From the EEG assessment tab on the Platform Program, under section 5 ‘Management Tools’, you can click a button ‘Edit Assessment Filters’. This will start a BioEra app:
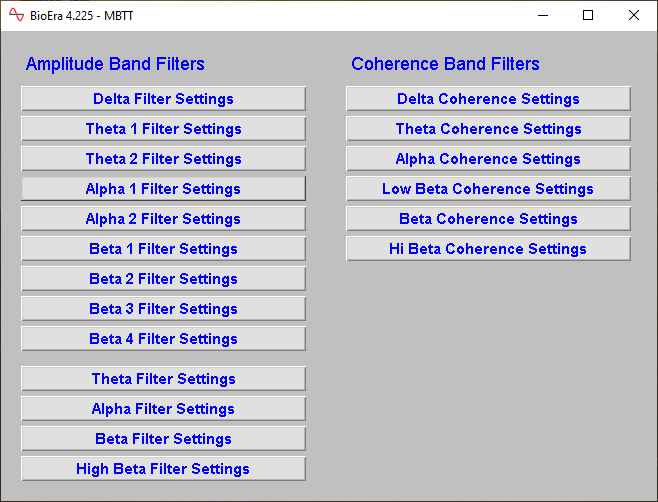
As you see it presents buttons for all the filters that can be adjusted - this includes the standard digital filters but also coherences.
The filter adjustment dialogs within BioEra look like this:
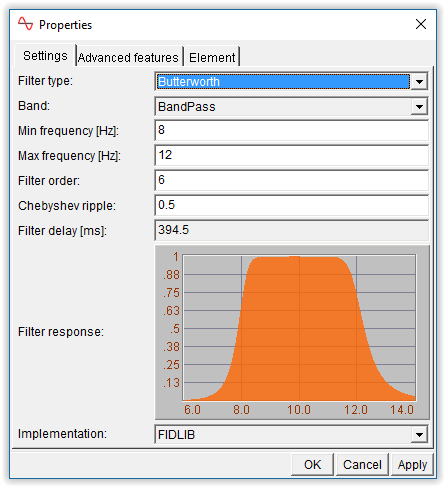
You see that you can adjust other settings besides frequency range. Explaining all these is beyond the scope of this guide. TO_DO
Overview of the Assessment Data
The BioEra recording app actually creates a number of files, each storing different types of data. As mentioned, the software uses both digital filtering and Fourier or FFT methods. It writes a text file for each type: one containing amplitude data derived from filtering, a second containing FFT-derived data. A third text file contains coherence data, in the case that you record from more than one site at once.
The final file type is .edf, which stores raw EEG data and, being a standard format, can be read by other software such as EDFbrowser or EEGlab.
Epochs & Sub-epochs
Our earlier discussion of protocols indicated that data is divided into a sequence of periods called epochs, each of which may be for example 30 seconds in duration. Each epoch has a condition associated with it, one of EC or EO or CC.
The BioEra recording app writes a line of data to each text file, once per second. Each one-second period is called a sub-epoch, so each line of data summarises a sub-epoch. The sub-epoch also stores which epoch it belongs to, and whether or not artefact was detected. (Artefact processing is covered in a separate section later in this guide.)
When MBTT generates reports, it uses the epoch and sub-epoch data (excluding any sub-epochs affected by artefact). For example, you might have a line graph showing alpha amplitude over the course of the recording, with one data point drawn per sub-epoch. Sub-epochs are also used to calculate variability measures, such as standard deviation, giving you an indication of how stable parameters are.
It's possible to open and edit the text files, though this is probably only desirable for advanced users. More details are given in the section on managing data.
Assessment Protocols
Each assessment protocol (selected in the EEG Recording dialog see above) has a set number of epochs, which can't be changed, however you can set how long a protocol lasts - this is done from within the BioEra recording app.
The EEG Recording dialog shows a list of nine protocol options - here it is again:
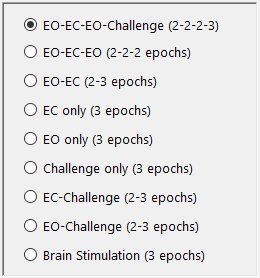
The numbers in brackets indicate the number of epochs for each condition. Thus the second option, "EO-EC-EO" has two epochs for each condition making a total of six. If each epoch lasts 20 seconds the app will collect two minutes of artefact-free data (the recording itself may be longer if artefacts are detected).
Note, some of the epochs are later designated as transition epochs by the software. For example, when using EO-EC-EO, the first of the two EC epochs is a transition epoch and will not be used when calculating average amplitudes for the EC condition, since we want to give time for the EC EEG to fully establish itself.
TO_DO consider adding a table with notes about the protocols.
The EEG Data Recording App (BioEra App)
When you've set up your electrodes, checked impedances and/or inspected your signals for quality, and selected a recording protocol, you're ready to record EEG. Click ‘Run BioEra Assessment App’, step 5 in the Record dialog.
This launches the main BioEra recording app, which looks like this:
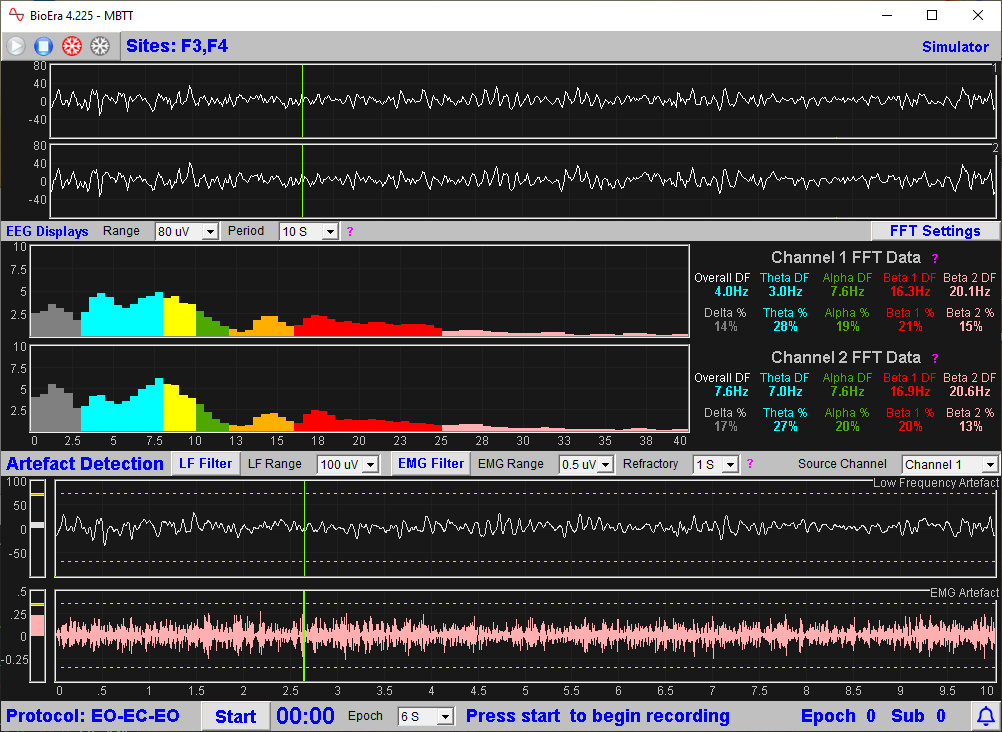
Broadly speaking the upper third of the window shows raw EEG traces, the middle third shows FFT or spectral analysis data, while the bottom third is devoted to artefact detection.
If you're working with four or eight channels, you can view two channels at a time and a drop-down list enables you to switch between them. This only affects the displays - you will of course record data from all channels.
Start the flow of EEG data by pressing the play button in the top left corner - but note this doesn't yet start the actual recording of assessment data. You first have time to ensure things are set properly.
You will probably want to examine the signal quality, adjust the artefact detection settings, and maybe adjust the FFT settings. You can also set the duration of each epoch using the drop-down list in the bottom row.
When you're ready to record, press the ‘Start’ button in the bottom row. A line of text in the bottom row indicates the stage of the recording and current recording condition (EC, EO, etc.).
Please note, the software will play a bell-ring sound at the points where the condition changes (e.g. from EC to EO). You can test sound this by clicking on the button in the very bottom right corner.
Artefact Detection & Rejection
Artefact is a source of contamination in the data. In other words, a component of the measured signal is not originating from brain activity but some other source. The most common sources of artefact are muscle activity, eye movement, electrode and cable movement, and external electric fields such as electric devices or the mains. When EEG data is not clean (contains artefact), it would be best to exclude it from the calculations of assessments - that is the point of the artefact rejection features of the software.
Sub-epochs that contain artefact are marked as such in the text data files, and hence are easy to exclude from calculations, charts etc.
Effective artefact rejection depends upon correctly identifying true artefacts without excluding (too much) clean EEG.
How Is Artefact Detected?
Artefact is either intermittent or constant. The most common source of constant artefact is mains contamination. It manifests as rhythmic activity at either 50 Hz or 60 Hz and can be seen in the raw EEG signal, and also as a clear peak at 50 or 60 Hz in the FFT (spectral display). If you see it, you must address it (as far as possible) before you start recording as the software cannot exclude it afterwards.
Most intermittent artefacts manifest either in the low frequency part of the spectrum, or the high. Low frequency artefacts are movements, cable movements, and especially eye blinks. High frequency artefact is generally muscle tension.
The software uses two filters detect low and high frequency artefact independently. These two filtered components are shown here:
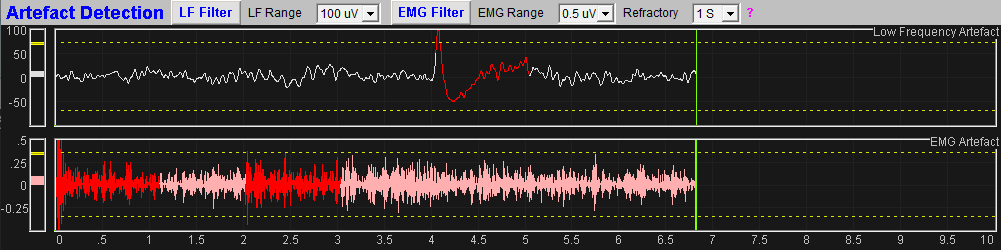
The upper trace represents the low frequency component and the lower trace is the high frequency component. You can adjust the frequency of each, by clicking the filter buttons.
EMG for muscle tension ideally uses a frequency range of 100-200 Hz, but to detect this you need a device with a sample rate of at least 400 SPS, preferably higher. If you're using a sample rate lower than this, say 250 SPS, then you can adjust the EMG filter range upper limit to be not more than half the sample rate.
Threshold-Based Artefact Detection
Artefact is deemed present when either of the two traces crosses a limit (threshold) represented by the dotted yellow lines.
In the image above you can see there is a clear eye blink in the upper trace (low frequency). The trace turns red when artefact is detected. You can also see a couple of samples of muscle tension artefact in the lower trace.
When the signal drops back below threshold, it's good practice to set a short “refractory period” which is also to be excluded. You can set the length of the refractory period using a drop-down control. You see that the traces stay red for the whole of the refractory period.
In practice it means that at least two adjacent sub-epochs will be labelled artefact and excluded (using a refractory period of 1 second) - that is, the sub-epoch in which the threshold-cross first occurs, plus the next one.
Effective artefact rejection means setting the thresholds in the right place.
To adjust the threshold levels, drag the yellow bar at the left hand end with your mouse. (There is no way to automatically set these threshold levels.)
Probably the best way of working is to have the assessment subject deliberately (i) blink several times and (ii) swallow or sniff a few times, as a way of showing what artefacts look like, so that you can move the level to somewhere appropriate.
Artefact Detection in the 2, 4 and 8 Channel Applications
In the multi-channel applications, you can only detect artefact in one channel at a time. However, you can select which channel to use as the basis of artefact detection, using a drop-down list control.
Probably the best channel to choose is one nearest to the eyes (i.e. at the front of the head). EMG tends to show up across the head but maybe strongest in the temporal sites (T3 or T4).
Note, eye movement artefact can still enter into EC recordings.
FFT Settings
The BioEra EEG Recording app computes spectral analysis or FFT, which is both displayed in the app and written to the data file for use in report generation. The user can adjust some settings for this FFT computation if desired. Notice a button in the upper right side of the app main window, which when clicked opens up this dialog:
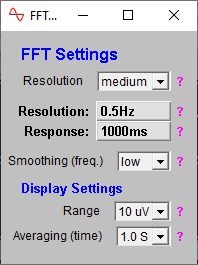
Here we'll give a brief description of the effects of one or two of these settings, with reference to the FFT chart which is reproduced here:
- Resolution: the higher the setting, the more individual bars there are in the display. A higher setting means the FFT takes longer to compute, and thus there is a small time lag between the FFT display and the raw EEG.
- Smoothing (frequency): this sets how much the bars of the display are smoothed across adjacent bars.
Be aware that the resolution of FFT, and time required for data processing, is influenced by the sample rate of your device.
Please note, changing FFT setting can sometimes have unpredictable consequences in terms of down-stream data processing, and I recommend you stop and restart the application after changing settings.
Band Amplitude Trend Displays
The BioEra EEG Recording app has a second window which contains trend charts showing standard band amplitudes over a time scale roughly the same as the recording duration:
Data Analysis & Report Generation
To recap, the assessment process involves making one or more recordings of EEG data, which can then be combined into summary reports. To create reports, click on the buttons in the EEG Assessment tab of the Platform program. Here it is again, this time shown with all the buttons activated (which happens once you have created or selected an assessment folder).
Reports are created in html format and are opened for viewing in your computer's default web browser.
The purpose of reports is to provide a basis for selecting EEG neurofeedback training protocols, and also to track progress with training.
Reports are a way of summarising useful EEG patterns and markers. They combine data derived from both digital filtering and FFT methods of analysis. They include band amplitudes and band amplitude ratios (derived from filtering), also spectral analysis charts. They compare different conditions (EC, EO and CC) and they compare sites in different parts of the head (for example left-right comparisons).
Report Options
When you click a button to create a new report, you'll see a dialog window offering a set of options related to the report:
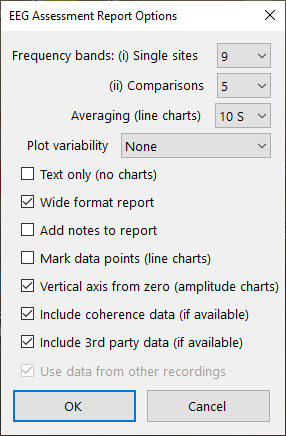
Most of these options should be self-explanatory, but I'll make mention of a couple of key points:
- For frequency band amplitude bar charts, you can opt to divide the frequency range up into either five divisions (delta, theta, alpha, beta and fast beta) or nine bands meaning that e.g. the theta and delta band ranges are sub-divided into slow and fast).
- You can opt to show measures of variability such as standard deviation or inter-quartile range. These variability measures are shown as “error bars”. They give an indication of how stable or unstable the EEG has been over the recording. They are calculated from the sub-epochs, which remember are once-per-second data.
Report Charts
Here are some examples of the data and how they are presented in charts:
Band Amplitudes Bar Chart, comparing conditions
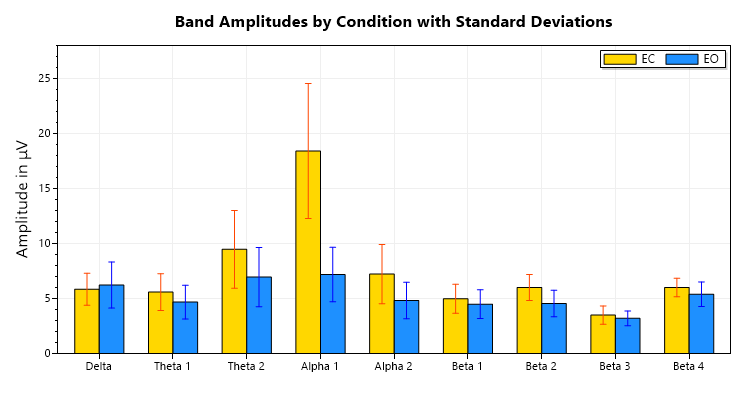
Here we see the frequency bands along the horizontal axis, and three bar series for each of the conditions. Each series is recorded from the same site.
Having frequency along the x axis makes it look something like a spectral analysis chart, but this data is derived from a set of digital filters, not from FFT analysis.
Band Amplitudes Bar Chart, comparing sites
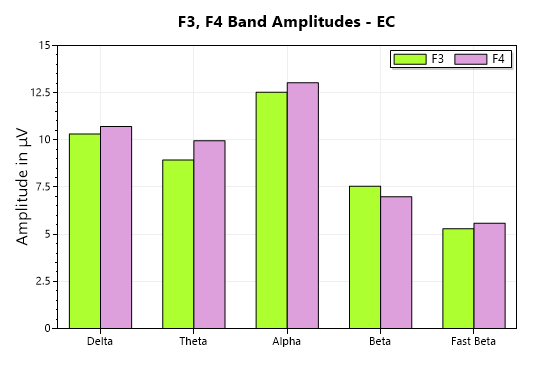
Again we have frequency along the horizontal axis, but this time the two series derive from different scalp sites, in this case F3 and F4, which are symmetrical in the brain's front-to-back midline, meaning the chart is giving us a Left-Right comparison. Again the data derives from digital filtering, not FFT.
Amplitudes Line Chart, showing transitions between conditions
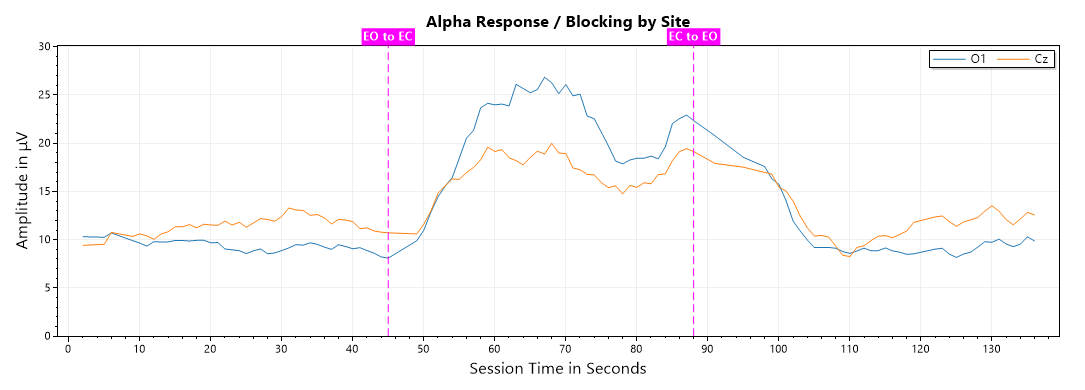
This time the horizontal axis represents time, and we see the progression of band amplitudes over the course of a recording. The vertical dashed lines represent transitions between conditions, first between EO and EC, then secondly back to EO again. (The bar charts above don't give information about time sequence.)
This type of chart is useful for assessing how well alpha rhythm responds to eyes closing, and then how well it blocks when eyes open.
Spectral Analysis Chart, showing relative FFT
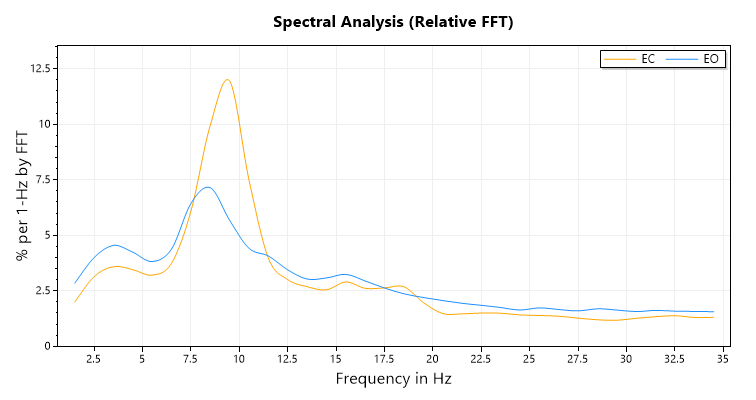
This chart shows a "relative FFT amplitude" - the vertical axis shows percentage. We need to explain how this chart is derived.
Once per second, the BioEra Recording app outputs FFT data to a text file as a set of thirty numbers, each number being the “normalised” amplitude of a 1 Hz frequency range. Normalised means that they are scaled so that the full set of numbers adds up to 1.00 (or 100 %) while still retaining their relative proportions.
Next, the chart generation code averages the FFT over the course of the recording - so for example each sub-epoch includes a number for 10-11Hz, and we take this number for each sub-epoch and average the set, then plot this average on the final chart.
The following sections describe each of the report types.
The Site Analysis Report
This report is based on a single site recording. It shows:
- A bands amplitudes bar chart with each condition (EC, EO, CC) shown as a separate bar series.
- A bands amplitudes line chart showing the time progression of amplitudes, with each condition shown as a separate line.
- A relative FFT amplitudes chart showing frequency distribution, with each condition as a separate line
- Another line chart showing time progression, this time of dominant frequencies.
You can see a sample Site Report here.
The Sites Comparison Report
This report contrasts recordings from two sites highlighting differences between them. It's useful for assessing left-right balance in the brain, also front-back balance.
It shows:
- Bands amplitudes bar charts with each site shown as its own bar series. There are separate charts for each condition, EC, EO and CC.
- Relative FFT charts, showing frequency distribution, with one line per site, and there are separate charts for each condition again.
- Bar amplitudes as in 1 above, but this time showing dominant frequency in place of amplitude.
- If coherence data is available, a bar chart showing band coherences, with a separate series for each condition (EC, EO etc.).
You can see a sample Sites Comparison Report here.
The Multi-site Assessment Report
This report type is more complex, being based on multiple recordings. It has a number of sections:
- A “map” of frequency band amplitude bar charts, one chart per site.
- A “map” of relative FFT charts, one chart per site.
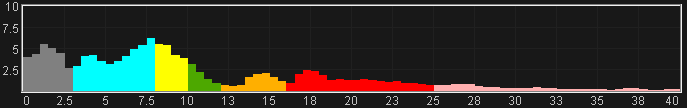
- Theta:Beta Ratio section, with tabulated data plus a bar chart.
- Alpha Response section including a line chart of alpha amplitudes, plus calculations of percentage alpha response and blocking by site.
- Alpha Speed section, highlighting alpha dominant frequencies
- Theta:Alpha Ratio section
- Left-Right Balance section, with charts contrasting left-right site pairs such as F3 and F4, in the main frequency bands.
- Front-Back Balance section - similar to the left-right balance section, this aims to reveal the relationships between the front and back of the brain.
You can see a sample EEG Assessment Report here.
Multiple Recordings from the Same Site
There is nothing to stop you making more than one recording from the same site. If this is the case, the assessment report generation code needs to decide which recording to use. It does this based on the assessment protocol. It will preferentially use a protocol which is higher in the list of protocols that you see in the EEG Assessment Record dialog. In the case that recordings were made with the same protocol, the earlier recording will be used.
Reviewing Data in BioEra
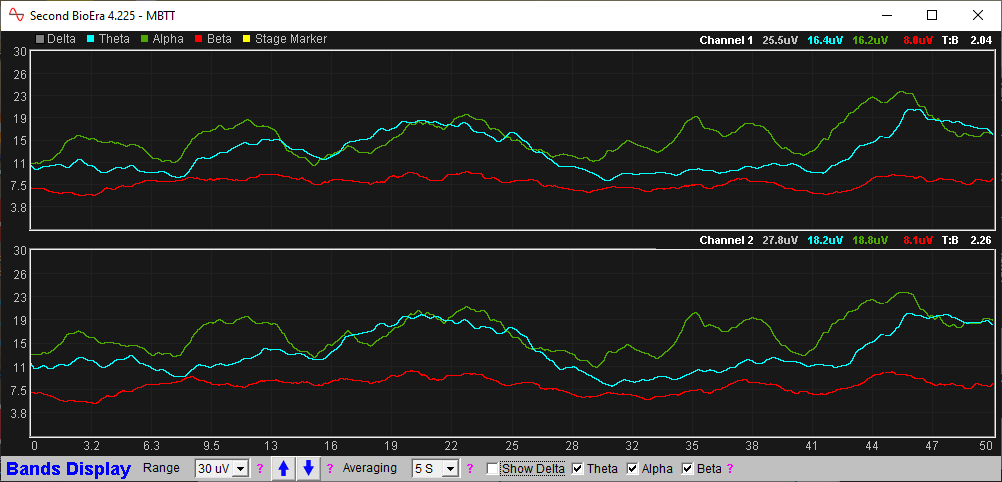
In addition to creating the above reports, you can also view EEG assessment recordings in a BioEra review application. Click the button, ‘Review Recording (BioEra)’ in the EEG assessment tab of the Platform. You'll be prompted to select a site recording, then you'll see this BioEra app:
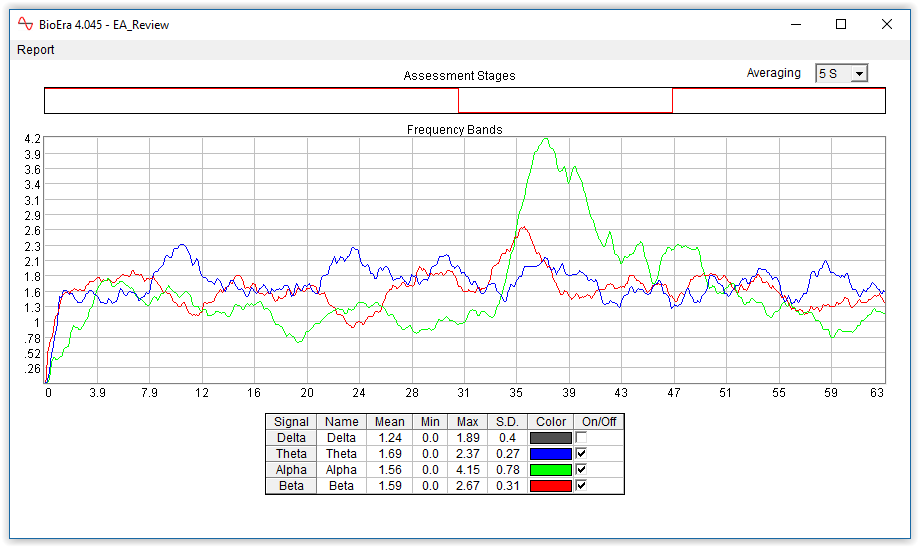
You see the chart shows the progression of the four main frequency bands over the course of the recording. These bands can be hidden or shown using the check boxes in the table at the bottom.
Note, a limitation is that, unlike the summary reports, the BioEra app cannot exclude artefacts.
This session was recorded using the EO-EC-EO assessment protocol. You can see from the upper 'Assessment Stages' chart that there were three phases. You can see that the green alpha trace increases significantly during the eyes-closed phase of the assessment.
You can set the level of averaging or smoothing using the drop-down control at the top.
You can zoom in on a portion of the session by clicking and dragging your mouse in the main chart, to select an area of interest. If you click and drag over an area of the axis, you will zoom in on one dimension only. Alternatively right-click your mouse over the main chart area to bring up a menu offering numerous zoom options (including reverting to the full chart area). Note that if you zoom in on a sub-section of the horizontal time axis, the upper chart showing the assessment phases will not update in sync with the main chart.
You can print the report – click on the 'Report' menu (top left). Please note the print function has some limitations. I suggest using the print preview function – note that the dotted box is the print area, and you will probably need to resize the report window to fit everything in.
The Site Progress Report
As mentioned earlier, one of the main purposes of running EEG assessments is to show progress (or lack of it) over the course of weeks of EEG neurofeedback training. This is what the site progress report is about.
A meaningful progress report requires that you make at least a few assessment recordings, separated in time (by days or more likely weeks, or even months). The report shows data from a single site, for example Cz, which you're prompted to select when you generate the report. Clearly you should have recorded from Cz at least a few times.
Note, you don't necessarily have to run a full multi-site assessment on a regular basis. You might run one full assessment at the outset of training, and then at intervals perform a single site recording.
Here is an example of a chart drawn from a progress report (though not using real data):
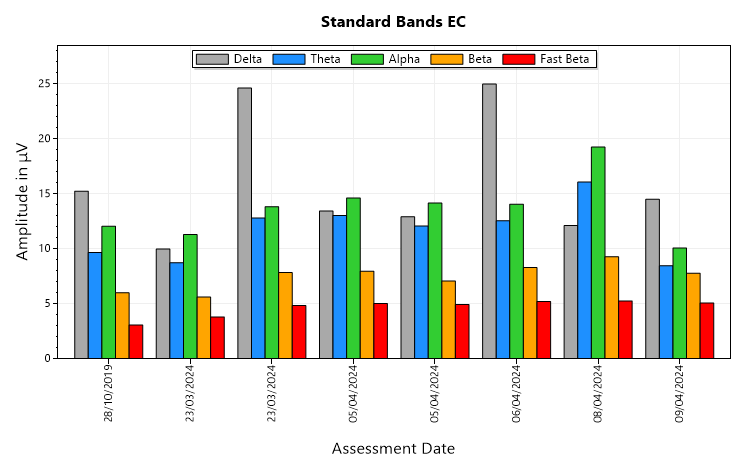
All the charts in the progress report follow this pattern: the assessments are shown along the horizontal axis, ordered by date. In this case we have a bar chart showing the main frequency band amplitudes, with one bar series per band - for example all the green bars represent alpha amplitude.
The report generates different charts for the EC and EO conditions. Other charts show dominant frequencies and significant band ratios such as theta to beta.
You can see a sample Site Progress Report here.
Managing Data
The software allows you to manage data – e.g. you may decide to delete a particular recording (and not use it in the assessment report).
Clicking on the button “Manage Assessments Data”, at the bottom of the EEG assessment tab of the Platform application opens a dialog for managing data:
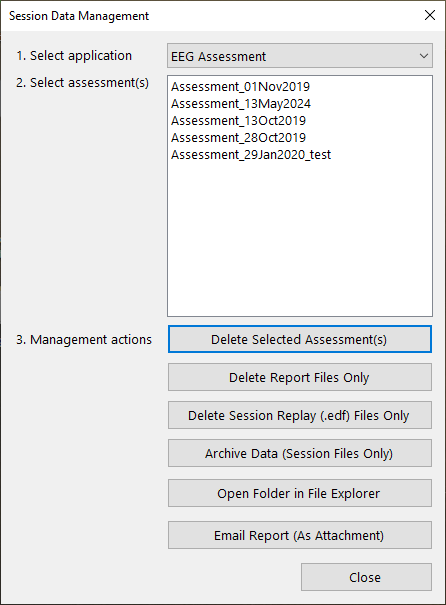
In this dialog you'll see a list of assessment folders. You can select one or several sessions (to select more than one, use Ctrl-click).
Management actions you can perform include:
- Delete Assessments(s) – this will delete all files associated with the selected sessions
- Delete Report Files Only – this will delete all files associated with the session, except the summary text file and the session .edf file – i.e. html files and their associated image files. You can always regenerate report files later.
- Archive Data – this firstly deletes all report files associated with the selected assessments(s), as per the previous function (i.e. excluding the text file and the edf file) and secondly moves the text files and the edf files into a sub-folder called “_archive”. Doing so means these assessments will not appear in the list of assessments. If you want to recover an assessment from the archive, you can do so “by hand” using the following function.
- Open Folder in (Windows) File Explorer – this may be useful occasionally, e.g. if you want to restore an archived assessments, you have to manually move it back out of the “_archive” folder. This function is also important if you decide to delete individual recordings, or at least exclude them from assessment reports, perhaps because you judged the data not good enough in quality. You would need to delete or move the text summary file(s).
- Email reports – this compresses all files associated with the selected assessment into a zip file, and emails this as an attachment. It includes whatever reports you have generated. This can be useful e.g. if you are a practitioner and want to send your client a report, or if you are working with a coach and want to email details of your progress. You can only email one session or report at a time with this function.
When you email a report you'll see a further dialog:
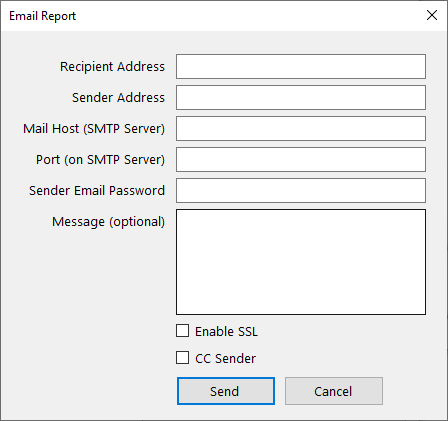
Besides entering the recipient address, you'll be required to enter your own (sender) address, plus details of your email server. These latter are remembered by the software for next time you want to send a report. Your mail server address typically has the form mail.your-domain.com, if you have your own domain with a hosting provider. If you use an email provider such as gmail or yahoo mail, you can probably find the information you need by googling e.g. “gmail smtp server”.
TO_DO.
Organisation of Assessment Data Files
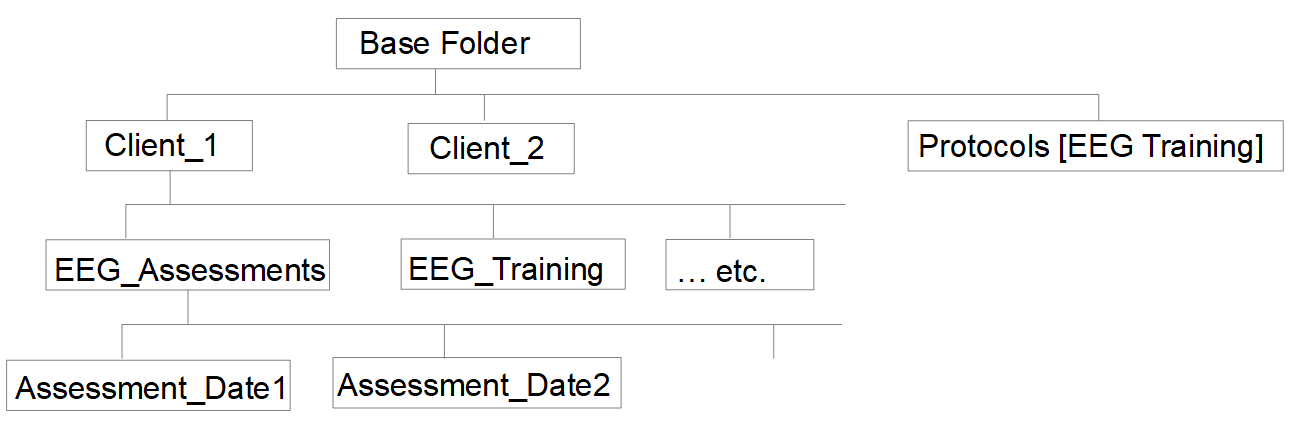
When you first run the MBTT Platform, you create or nominate a “base folder” which is the root folder containing all data associated with MBTT apps.
Within this folder, MBTT creates a sub-folder for each user you set up. If you're a professional practitioner you would create each client in the system and each would have their own folder.
Each client folder contains a set of sub-folders, one for each MBTT application (such as the Heart Coherence app). There will be one sub-folder for all EEG assessments for this client.
Within each of these assessment sub-folders, all data files and report files for that assessment are located. The diagram below shows this structure:
Site Data File Naming
The software creates a file name for your site data automatically, based on the site and protocol. An example would be “Fz_EOECEO.txt” - clearly this data is recorded from site Fz using the EO-EC-EO protocol. If you record twice from the same site using the same protocol, the software appends a number, e.g. “Fz_EOECEO_2.txt”. Please note, as described in section 3.3 above, only the first recording is used in generating the overall assessment report.
Editing the Site Name
If you realise after recording, that you made a mistake in selecting the site name, you can recover.
Navigate to the assessment folder using Windows File Explorer. You can do this simply from the Data Management dialog, as described earlier. Find the the incorrectly named file, e.g. “Fz_EC.txt”. Open it for editing using WordPad. At the end of the file you should see a line, “site Fz”. Change the site name to the correct one, e.g. Cz. Save and close the file. Lastly rename the text file, replacing the site in the file name with the correct one, e.g. to “Cz_EC.txt”.