Guide to Measuring & Quantifying Heart Coherence
Contents
- Introduction
- What Is Heart Coherence?
- Physiology of HRV & Heart Coherence
- How Is Heart Coherence Quantified?
- Spectral Analysis
- On The Nature of Heart Coherence Changes
- Extending the Coherence Score Concept - Experimental Applications
Introduction
HRV is a widely used parameter for biofeedback training, where the trainee aims to develop a particular pattern of variation called Heart Coherence or Heart Rate Coherence. This article explains what heart coherence is and how it can be measured and quantified.
What Is Heart Coherence?
A healthy heart has a natural beat-to-beat variation in rate, known as Heart Rate Variability (HRV). Coherence is a natural and reflex-like rhythm in the HRV, which research has shown to correlate to both physical and emotional well-being – that's why it's a useful biofeedback parameter.
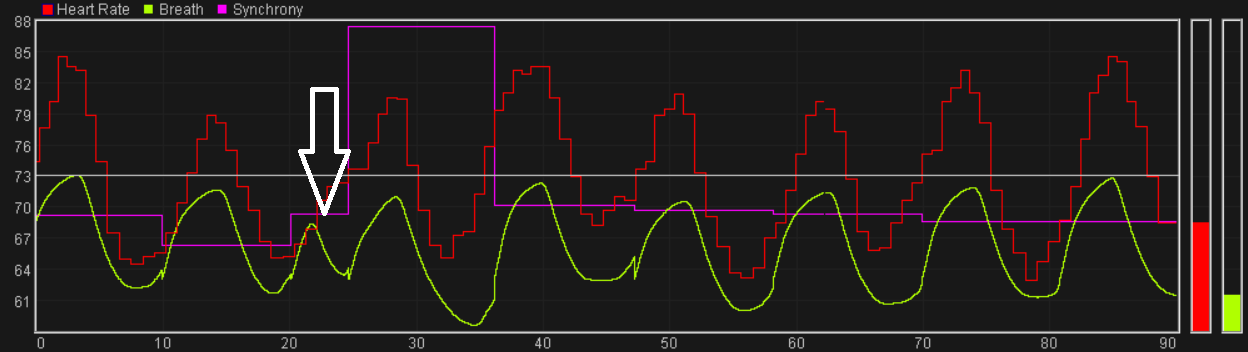
In HRC (Heart Rate Coherence), changes in heart rate become synchronised to the breathing, such that it speeds up when you breathe in and slows down when you breathe out. This figure shows the pattern:
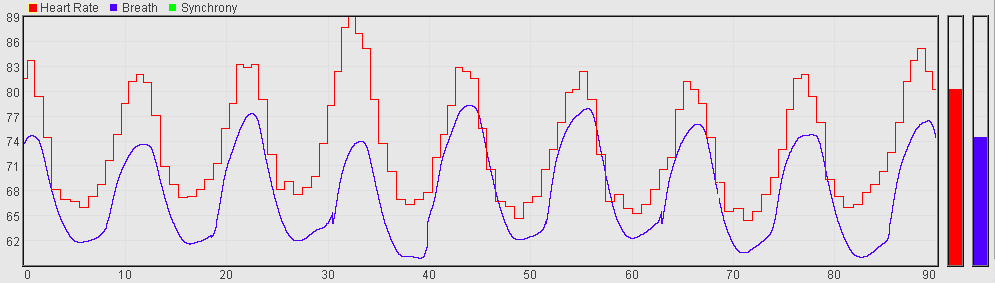
The red trace is the heart rate while the blue is breath. The red HR trace is stepped as it changes discretely at each heart beat. Note that it is the variation in heart rate that synchronises with the breath, not the heart beat itself (HR is much faster than breathing rate).
HRC normally develops when you are in an open, harmonious and emotionally positive state of mind – however negative emotions like anxiety and anger tend to disrupt it.
HRC can be quantified in various ways. High coherence involves regular large swings in heart rate. Clearly the degree of coherence depends on how you breathe – a slow regular breath at around 6 breaths per minute maximises the coherence (6 bpm seems to be a kind of resonant frequency).
Physiology of HRV & Heart Coherence
The physiological mechanisms behind HRV are complex, and largely beyond the scope of this guide. Understanding them isn't necessary in using the application. This section summarises what is known about the physiological mechanisms, but may be skipped if you prefer.
The pattern of HRV is strongly influenced by Autonomic Nervous System (ANS) functioning. The ANS governs many of our automatic and visceral responses. It has two branches, the sympathetic (associated with the “fight or flight” or stress response) and the parasympathetic (associated with “rest and digest”). So the two functions are largely opposite and mutually inhibiting, like a car's accelerator and brake, or like the two arms of a see-saw.
Both branches influence HR - the sympathetic NS raises it while the parasympathetic lowers it. When the parasympathetic is active, its influence is applied to the heart during exhalation, while during inhalation this influence is blocked. It is this mechanism which largely drives the rhythm in the heart rate (or heart wave), and also explains why the heart wave is synchronised with the breath. (The phenomenon is also known as Respiratory Sinus Arrhythmia or RSA.) When the breathing is slow, the rhythm is augmented by another physiological mechanism called the baroreceptor reflex. This is why HRC displays a kind of resonant frequency at around 6 bpm.
Conversely, sympathetic arousal tends to flatten out the heart wave, or at least break the coherence rhythm in favour of a more chaotic variation. It's quite easy to experience this effect in HRC training, where even distracting thoughts and images can provide the necessary stimulus.
How Is Heart Coherence Quantified?
This section explains how HRC is quantified. For this software I developed innovative methods, not available in other biofeedback products.
Considering HRC more closely, we can say that three factors characterise good coherence.
- The swings in HR over the cycle of the breath are large – the heart may speed up by 20 beats per minute or more during the inhalation, and then slow down again by the same amount during the exhalation.
- The changes in HR are consistent or stable over the course of successive breaths.
- The HR rhythm (or 'heart wave') is tightly coupled to the breath – in other words, the maximum heart rate occurs at the same time as the end of the inhalation and beginning of the exhalation, while the minimum heart rate occurs at the opposite turning point.
The application's two main HRC parameters (coherence score and heart-breath phase difference) attempt to capture these characteristics – the former two especially in the coherence score, and the latter in phase difference.
Most biofeedback applications quantify HRC using spectral analysis, or Fourier analysis. This application also offers spectral analysis, though it is not used to calculate coherence score.
Coherence Score
This section describes in some technical detail how the coherence score is calculated. It certainly isn't necessary to understand these details in order to use the application, so you may skip over the section entitled 'algorithm'. However it is worth summarising some features:
- Coherence is calculated over a moving window of 5 breaths, meaning it can be relatively slow to change, and not necessarily easy to achieve a score above zero.
- When the synchronisation between breath and heart wave is lost, the coherence score quickly goes to zero. I believe this offers an advantage over the usual spectral analysis-based methods.
Coherence Score Algorithm
For those interested, the method is as follows:
- At the beginning of each inhalation, the minimum HR for the preceding exhalation is noted.
- At the beginning of each exhalation, the maximum HR for the preceding inhalation is noted.
- For each half-breath (either inhalation or exhalation), the difference between the above two is calculated – this may be thought of as the “amplitude” of the heart wave - this figure shows two successive such amplitudes:
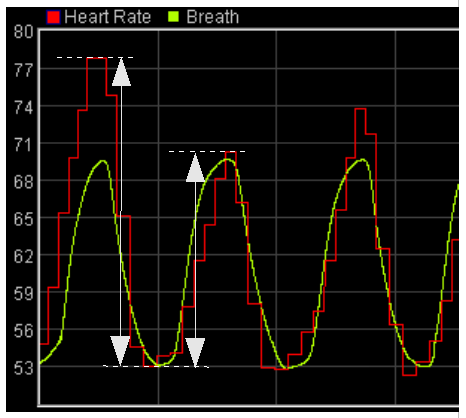
- Using a moving window of 5 breaths (or ten heart wave amplitude calculations) we calculate the mean (average) and standard deviation (SD) of this heart wave amplitude.
- In good coherence, the mean will be large (reflecting the first of the above characteristics) while the standard deviation will be small (reflecting the second characteristic). So the coherence score is defined simply as:
coherence score = ( mean – W x standard deviation ) x S
In this equation W is simply a fixed weighting factor and S is a fixed scaling factor, chosen so that a score of 100 represents very good coherence (though it is not a maximum).
In the user interface coherence score is usually shortened to HRCS.
Heart Wave Amplitude as a Parameter in MBTT
To recap, in the coherent state, the heart rate trace shows an oscillation which I've informally called the “heart wave”. The "heart wave amplitude" is then the size of this wave, in the vertical dimension, as indicated by the two white arrows in the above graphic.
MBTT's Heart Coherence app (advanced version) has this parameter as a feedback parameter with its own threshold.
Heart-Breath Phase Difference
In the context of this application heart-breath phase difference is defined as the difference in seconds between the time of the maximum heart rate, and the time of the minimum breath temperature, which occurs at the top of a breath (between the end of inhalation and the beginning of the exhalation) – depicted here:
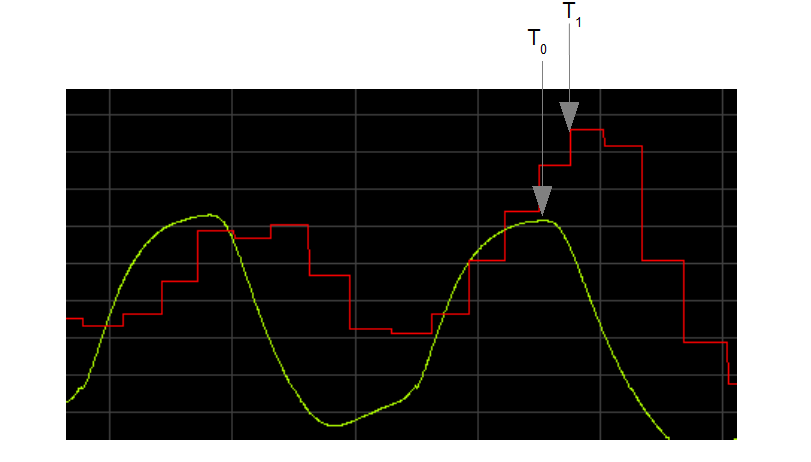
- Phase difference is calculated once per breath. It can be positive or negative.
- A positive phase difference means that the breath turns around before the heart wave – the heart wave is following the lead of the breath.
- A negative phase difference means that the heart wave turns around before the breath – the breath is following the lead of the heart wave.
- If there is no degree of HRC, phase difference values will still be calculated but will be meaningless.
In some parts of the software, described later, average values of phase difference are used. Two variants in particular are calculated:
- The average of the magnitude of the phase difference – the sign (positive or negative) is dropped. This is because the actual average is likely to be close to zero, which is in some sense misleading as it may not capture the difference between a tight synchrony varying either side of zero, and a loose synchrony of larger magnitude.
- The average of the actual phase difference – sign included. This measure has the advantage that it will express whether the breath is consistently ahead of (or following) the heart wave.
In both cases the averaging is over six breaths.
Spectral Analysis
As mentioned, spectral analysis is an alternative means of quantifying HRC. For the most part MBTT does not base its feedback on this method, but a spectral analysis display is available for those interested. This section explains the essential meaning of spectral analysis in a mathematically non-rigorous way. It is still rather technical but can easily be skipped over.
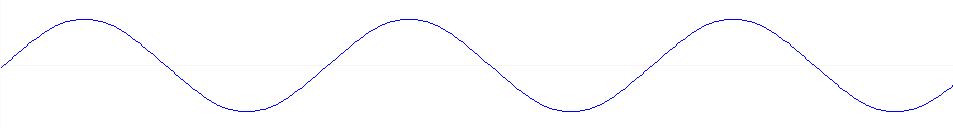
Spectral analysis is a mathematical transformation of the heart rate data. The starting point is a set of values of successive inter-beat intervals (IBIs). When arranged sequentially and graphed, we would see a pattern that would look a lot like the heart rate trace which the application presents. In cases where good coherence is present, we would see a regular wave as you see here:
Regular waves in their pure form are known mathematically as sine functions. Here is a chart showing a single sine wave.
Fourier's theorem states that any complex oscillation can be reproduced by adding together lots of sine functions, with differing frequency (or wavelength) and magnitude (or height).
We can express this idea pictorially – here three different sine waves are shown (blue, green and red traces):
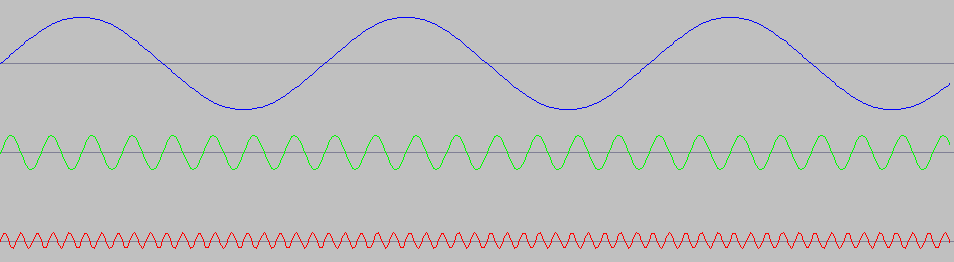
The three waves differ in both amplitude (height from peak to trough) and frequency (of crossings of the horizontal axis).
A more complex oscillation is shown here:
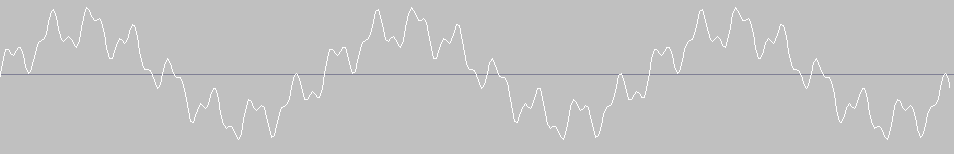
Can you see that this complex wave is actually the sum of the three simpler sine waves?
Spectral analysis is the inverse process – breaking a complex oscillation down into component sine waves.
Here we show the spectral analysis of the composite white oscillation we've just seen:
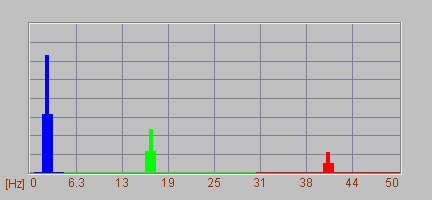
In this new type of chart, each point on the horizontal axis now represents some particular frequency (or wavelength), and the height of the graph at that point represents the size, or the amplitude, of that particular component sine wave.
Hopefully you can see how it makes sense. Each of the three peaks corresponds to one of thee component sine waves. Each peak's height correlates to the amplitude (height) of its associated sine wave.
Returning to heart rate data – I hope you can now see that the spectral analysis of coherent heart rate data, since it looks a lot like a sine wave to begin with (the chart we saw at the beginning of this guide is an example), will have one dominant and sharply defined peak. Here is an example:
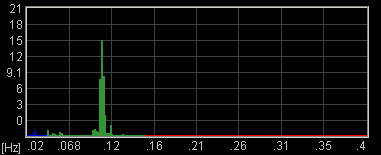
The frequency of this peak is approximately 0.1 Hz (1 Hertz means one cycle per second). Since we know that the breathing follows the heart wave, we can infer that this data resulted from breathing at 6 breaths per minute (=0.1 breaths per second).
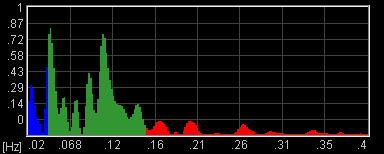
This chart shows the spectral analysis of a much less coherent set of heart rate data:
Our final example shows the spectral analysis that resulted from a period of breathing at 8 breaths per minute, followed by a short period of breathing at 6 breaths a minute:
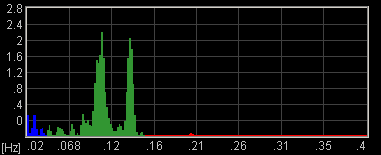
The heart wave was coherently synchronised with the breath throughout. We see two peaks, one for each breathing rate.
This spectrum was computed based on a time window that was long enough to include both breathing rates, hence the two peaks. This brings out some important points about the nature of spectral analysis:
- The spectrum computation is always based on some finite time period, it is not an instantaneous measure. In the case of HRV you'd really need at least half a minute, but in principle you could also calculate a spectrum based on a half hour of data.
- In biofeedback software, a spectral analysis chart is constantly changing over time because it's based on a moving window of heart rate data (i.e. the most recent n seconds).
- It's far from obvious, just by looking at a spectral analysis chart, how long an interval was used. (EEG spectral displays may be based on an interval of 1 second or less.) To properly interpret a spectral display, you would want to have some idea of the period.
- A spectral display doesn't convey information about sequence, i.e. what happened first and what came later. e.g. the chart with two peaks, we can't say if the 6 bpm period came before or after the 8 bpm period.
The frequency range of HRV spectral analysis is traditionally divided into three. The standard bandwidths are given in the table below.
| VLF (Very Low Frequency) | 0.0033 – 0.04 Hz |
| LF (Low Frequency) | 0.04 – 0.15 Hz |
| HF (High Frequency) | 0.15 – 0.4 Hz |
As mentioned earlier, HRV is strongly influenced by ANS functioning, and indeed HRV is commonly used to assess ANS balance. “Activity” in the HF region is often interpreted as a reflection of parasympathetic activation. Some sources link the LF band to sympathetic activation, while others link VLF activity to the sympathetic.
However, it is important to note that this kind of analysis applies to data collected under “everyday” conditions – not during HRC training. For an adult the average breathing rate is 12-14 bpm, which is in the HF range. HRC with slow breathing, around 6 bpm, will pull the “breathing peak” down into the LF range, so in this case the LF range will predominantly reflect parasympathetic activation. The physiology is complex and one should be wary of over-simplistic interpretations.
On The Nature of Heart Coherence Changes
Once you've gained a moderate level of experience with heart coherence biofeedback training, you'll probably find that you can maintain stable good coherence for periods of time, and then there are interruptions where the coherence score drops off. If you're training coherence in a meditative context, you may notice the losses of coherence correspond to distractions and loss of focus.
Here is an example of such an interruption:
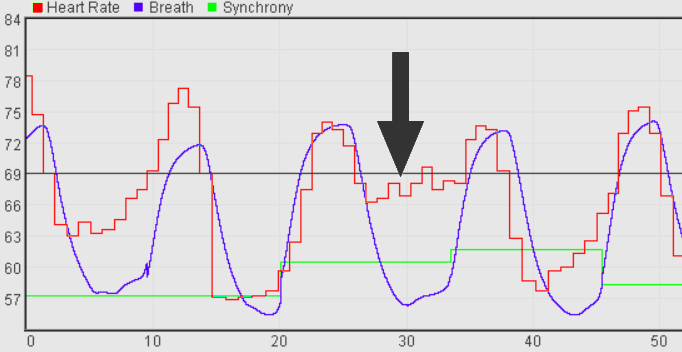
In my personal experience of practising meditation with heart coherence feedback, this is the most common pattern of loss of coherence: in the exhalation phase, the heart rate doesn't go all the way down to the extent that it did in previous breath cycles.
I interpret this in terms of a withdrawal of parasympathetic tone, which is the main driver of the decreases in heart rate. It seems to me this happens when a vaguely unpleasant or stressful distracting thought comes into my mind.
Falling Asleep from the Coherent State
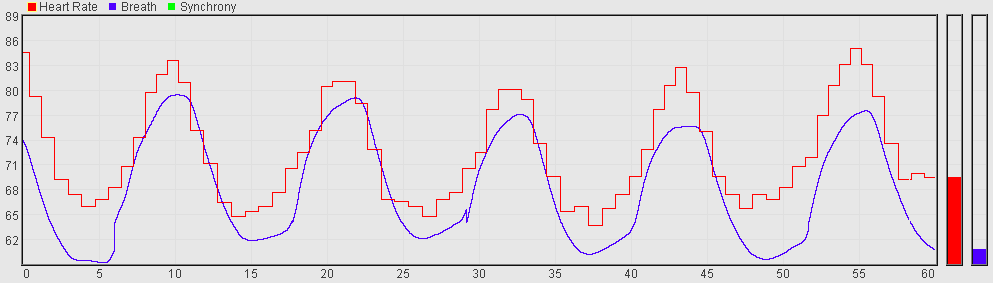
A less common form of loss of coherence happens when one falls asleep during meditation practice. Here is an example recorded with myself as the subject:
You can see that after the 20 second mark, about a third of the way from left to right, there is a sudden de-coupling between the breath signal and the heart signal: this is typical of what I see when I fall asleep. The breath has suddenly jumped in rate.
The de-synchronisation causes a precipitous drop in coherence score - you can see this in the long-term chart here (it happens half way across):
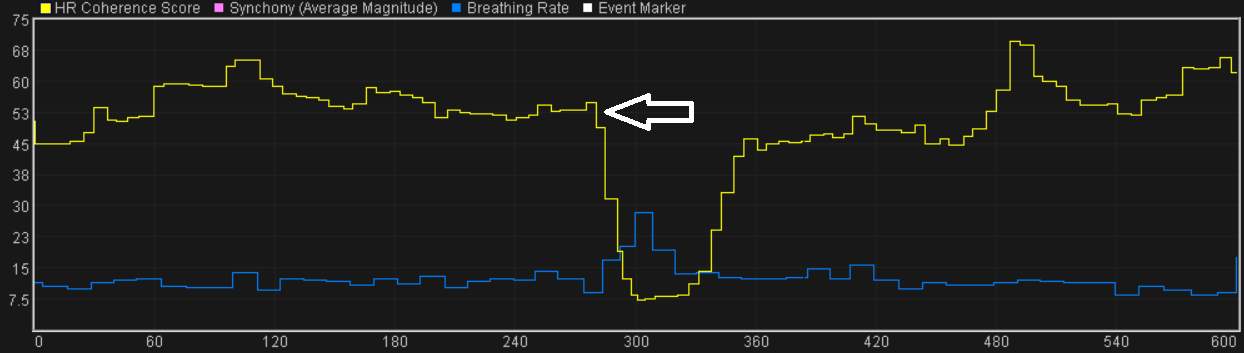
(You can also see that coherence has resumed pretty much straight away.)
Hopefully the fall in coherence score makes sense to you, given how it is calculated.
Extending the Coherence Score Concept - Experimental Applications
To recap, the basic idea is that heart coherence is a speeding up and slowing down of the heart rate (or equivalently inter-beat interval) in sync with the breath. But heart rate isn't the only parameter to show this kind of relationship to breath. Other parameters that MBTT can track include:
- Blood Volume Amplitude
- Amplitude of the ECG R-Wave
- fNIRS
It's a natural step to think in terms of a parallel concept of coherence, in each of these cases, so for example “BVA Coherence” by analogy to heart coherence.
Moreover, the algorithm for Heart Rate Coherence Score that we've seen here, can be easily repurposed for these new coherence concepts. We simply have to replace inter-beat interval (IBI) as the input to the algorithm. For example BVA in place of IBI gives us our new BVA coherence measure.
Let's look at each of these examples.
BVA Coherence
Blood Volume Amplitude is the “height” of the blood pulse signal that is measured by a photoplethysmograph (PPG) and is described in this article about heart measurement.
Here is an example of BVA rising and falling in sync with the breath:
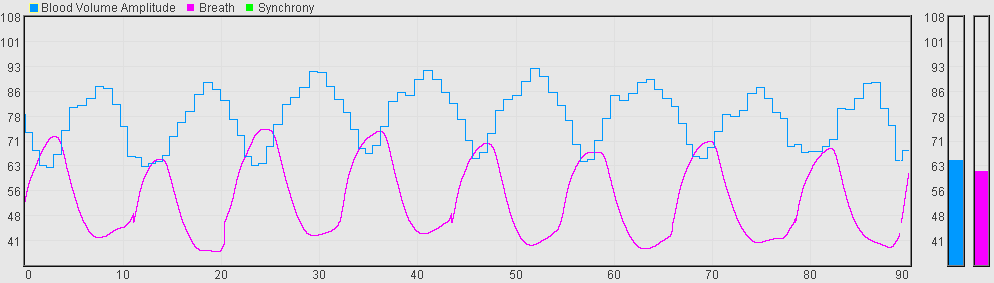
Actually we see that BVA varies in anti-phase with the breath, but it's easy to adapt the coherence algorithm.
As I've indicated, these new coherence measures must be considered experimental. Not all trainees will show BVA coherence, and my own experience of training it in myself is that it's sensitive or labile measure, meaning that the rhythm is much more easily disrupted.
RWA Coherence
R-wave Amplitude is the height of the R-wave - the R wave being the main “spike” of the ECG signal. Clearly it must be measured via ECG not PPG. Read more about ECG measurement here.
Here is a sample of R-wave amplitude rising and falling in sync with the breath:
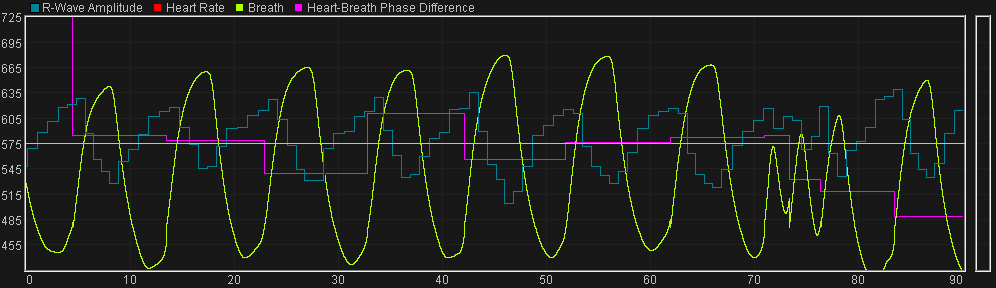
As with BVA, the relationship is anti-phase.
RWA coherence score can be calculated by repurposing MBTT's heart coherence algorithm, using RW amplitude in place of inter-beat interval.
A version of heart-breath phase difference can also be calculated - that is, the time lag between the peak of the breath and the minimum point of the RWA wave. My personal experience of working with the RWAC application is that the synchrony is much tighter (phase lag is much smaller).